
 1 year ago
75
1 year ago
75 The cryptocurrencies are facing resistance at the blue line ( 21-day SMA) moving average. This is an indication that the bears are still in control. The altcoins below are pulling back after a brief rally to the recent high. The bulls could not sustain the bullish momentum above the moving averages. Let us examine the weakest altcoins for the week.
Solana
Solana (SOL) is in a downward correction as price revisits the previous low at $35. Initially, the altcoin fell to the low of $35.30 on May 12. The bulls bought the dips as the cryptocurrency corrected upward. The upward correction was terminated at the high of $60.
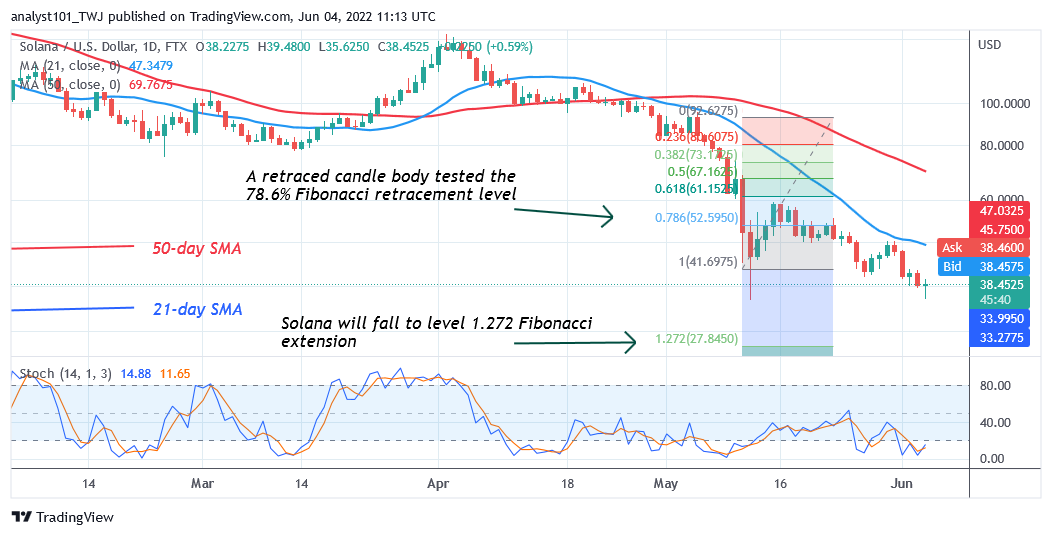 SOL/USD – Daily Chart
Solana resumed the downward move because of the rejection. Today, it has fallen to the low of $38 at the time of writing. Meanwhile, on May 12 downtrend; a retraced candle body tested the 78.6% retracement level. The retracement indicates that SOL will fall but reverse at level 1.272 Fibonacci extension or $27.84. It is the weakest altcoin at the moment. The crypto has the following features:
The current price: $38.39
Market Capitalization: $19,641,050,975
Trading Volume: $1,111,685,066
7–day Gain/Loss %: 11,65%
Convex Finance
Convex Finance (CVX) is in a downtrend and the cryptocurrency has fallen significantly to the low of $8.41. On March 7, CVX fell to the low of $15 from the high of $60. Later, the altcoin corrected upward to the high of $40. The upward move was interrupted as the market reached an overbought region.
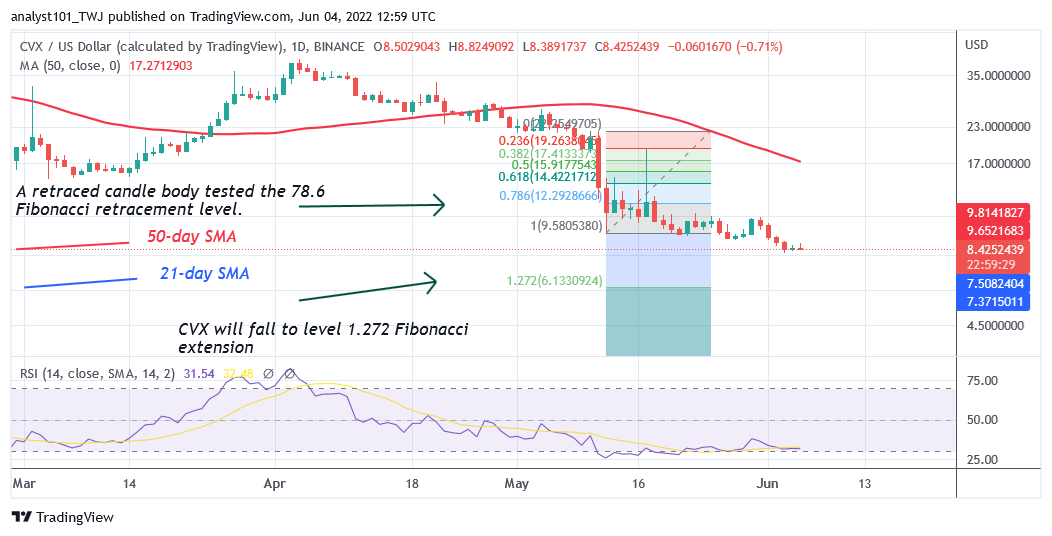 CVX/USD – Daily Chart
The downtrend resumed as the market declined to the low of $8.41. Meanwhile, on May 12 downtrend; a retraced candle body tested the 78.6% retracement level. The retracement indicates that CVX will fall but reverse at level 1.272 Fibonacci extension or $6.13. CVX is the second weakest altcoin at the moment. The crypto has the following features:
The current price: $8.43
Market Capitalization: $843,020,791
Trading Volume: $10,344,645
7–day Gain/Loss % : 8.72%
1inch Network
1inch Network (1INCH) is also in a downward correction as the cryptocurrency fell to an oversold region of the market. Before the recent downtrend, the altcoin has formed a bearish double top. The crypto retested the $2.00 resistance zone twice on February 8 and April 2 before the resumption of selling pressure.
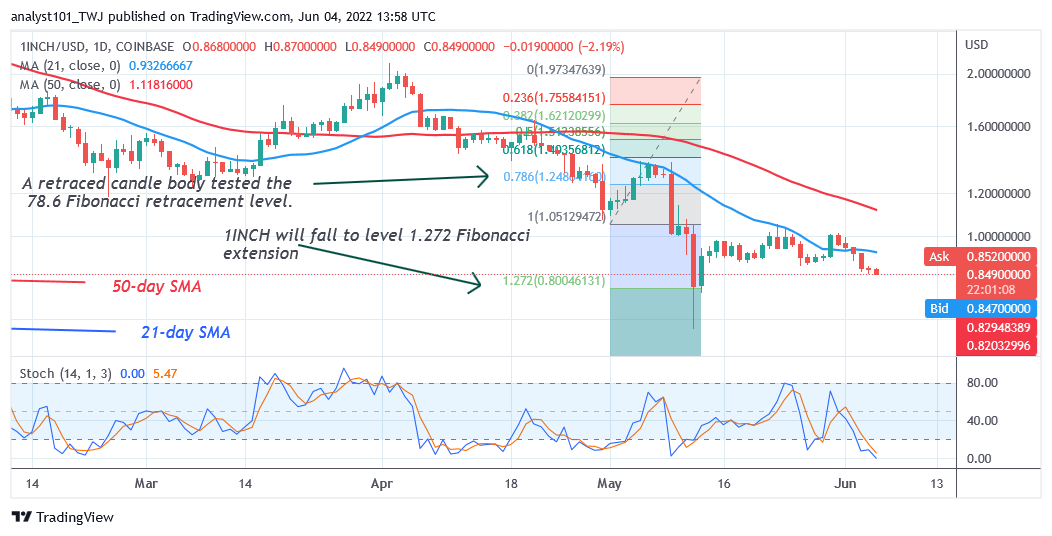 1INCH/USD – Daily Chart
The bears broke below the moving average to reach the low of $1.08 on May 1. Meanwhile, on May 1 downtrend; a retraced candle body tested the 78.6% Fibonacci retracement level. The retracement indicates that the altcoin will fall to level 1.272 Fibonacci extension or $0.80 price level. 1INCH is the third-weakest altcoin at the moment. It has the following characteristics.
The current price: $0.8525
Market Capitalization: $1,282,046,988
Trading Volume: $44,939,038
7–day Gain/Loss: 5.51%
Kadena
Kadena (KDA) is in a downward move as the altcoin fell to the low of $1.28 on May 12. The coin made an upward correction to the high of $3.45 but was repelled at the 21-day line moving average. The selling pressure has resumed as the altcoin fell and revisited the previous low at $1.28.
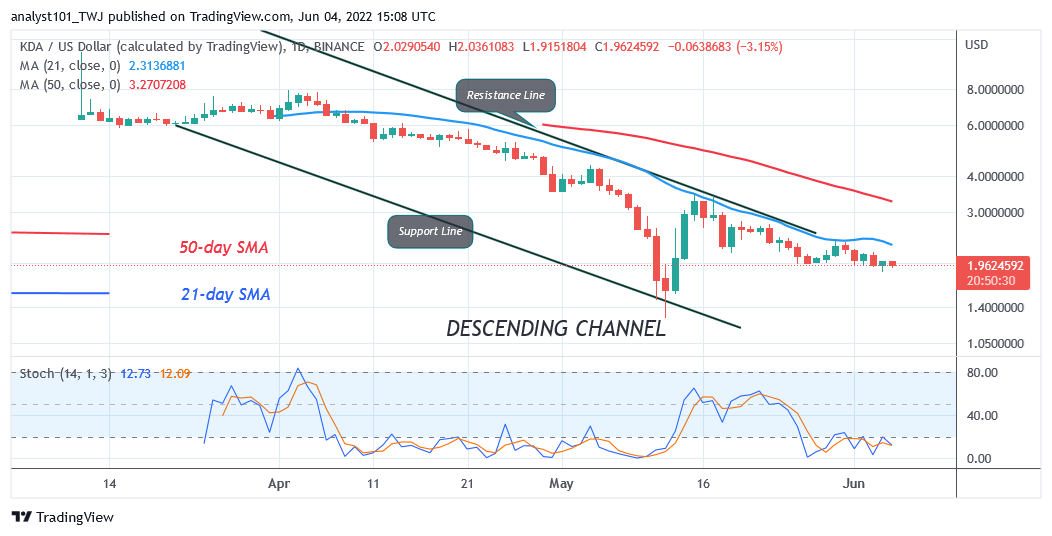 KDA/USD – Daily Chart
As the crypto falls to the previous low, the price action is characterized by small body candlesticks called Doji. Meanwhile, KDA is below the 20% range of the daily stochastic. The altcoin has reached the oversold region of the market. The selling pressure has reached bearish exhaustion. The cryptocurrency is the fourth weakest altcoin at the moment. It has the following features:
The current price: $1.96
Market Capitalization: $1,963,556,446
Trading Volume: $15,529,194
7–day Gain/Loss %:5.06%
FTX Token
FTX (FTT) was earlier in a sideways trend. The coin was fluctuating below the $49 resistance level. On March 27, the downtrend resumed after a false breakout above the $49 resistance zone. The bears repelled the bullish momentum as price broke below the moving averages.
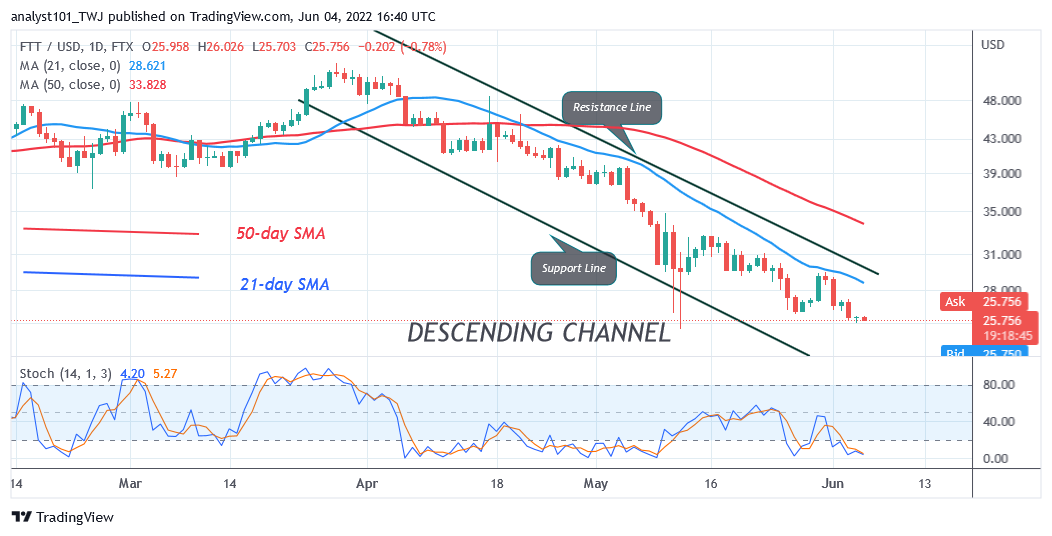 FTT/USD – Daily Chart
FTT plunged to the low of $25.76.The coin is below the 20% range of the daily stochastic. The market has reached the oversold region of the market. The selling pressure is likely to subside as the market reaches the oversold region. FTT is the fifth-weakest altcoin in the week. It has the following features:
The current price: $6.01
Market Capitalization: $6,010,558,233
Trading Volume: $267,243,044
7–day Gain/Loss: 23.45%