
 1 year ago
85
1 year ago
85 Lucky Block Price Prediction- May 9
The breakup of the $0.00161 resistance level by the bulls may increase the market value.
Key Levels:
Resistance levels: $0.00161, $0.00171, $0.00181
Support levels: $0.00135, $0.00125, $0.00115
LBLOCK/USD Long-term Trend: Bearish (4H Chart)
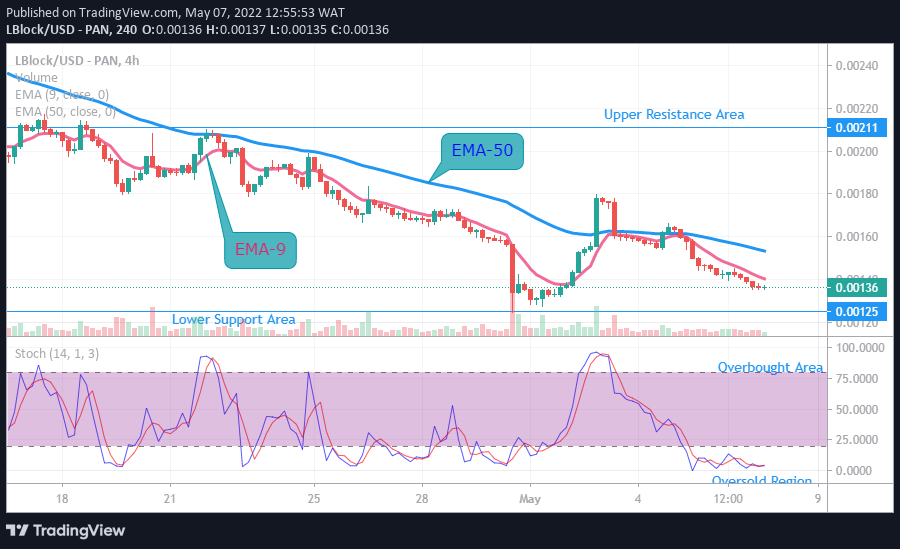
LBLock/USD pair is in a downward move as we can see from the 4-hourly chart here. The prices are seen below the two moving averages, an indication of a downward trend.
The downward move has reached bearish exhaustion. A further downward is unlikely as the market has reached the oversold region.
The currency pair will resume an upward trend or movement if the current support level of $0.00135 holds.
The momentum indicator also shows that the price signal is up at around level 5% in the oversold region. This will compel the buying pressure to resume sooner, as we expect the price distribution to reach the $0.00166 resistance level in the days ahead. 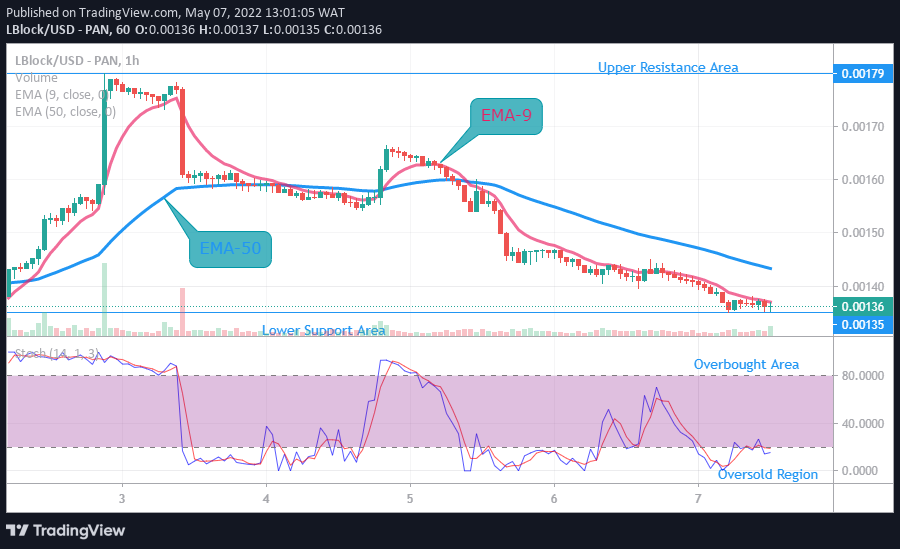 LBLOCK/USD Short-term Trend: Bearish (1H Chart)The bulls are coming into the market progressing upward on the 1-hourly chart. The price of the LBlock/USD may commence bullish movement soon if the support level of $0.00135 holds.
The price is expected to advance forward following the stochastic indicator signal that is pointing upward at around level 20% in the oversold region.
The buyers are expected to move the market price up to a $0.00160 significant level sooner.
You can purchase Lucky Block here. Buy LBlock