Bitcoin voyaged into unchartered territories following its dramatic breakout move above $22,000 on Thursday. And now, the flagship cryptocurrency is clueless about where to trend next.
Traders have no historical reference to guess short-term support and resistance levels. Nevertheless, many of them have predicted extended rallies for Bitcoin in the wake of supportive fundamental indicators. They include ever-expanding institutional capital inflows into the cryptocurrency market and a retail euphoria led by a bearish US dollar outlook for 2021.
Amid the bullish frenzy, meanwhile, are a few warnings about potential bearish corrections.
The RSI Factor
Bitcoin’s price rally above $20,000 had made it an overbought asset per some technical indicator readings (read the Relative Strength Indicator). That requires a certain degree of sentimental neutralization that could only come if traders with short-term risk appetite start withdrawing their profits.

Bitcoin RSI is yet to top out, leaving more room for price to grow. Source: BTCUSD on TradingView.com
A pseudonymous analyst shared the same narrative in his note published Thursday morning. He said BTC/USD could extend its uptrend until $23,000-24,000. But then, the pair could correct by roughly 20 percent, a move that could have it crashed to as low as $19,000. Excerpts:
“BTCUSD tops out with a weekly RSI value of 87-90. The price corresponding to the weekly RSI of 88.5 is $23k. RSI of 53 gives significant support. Its price equivalent is $13.6k, rising by $500 per week.”
Calls for a breakdown move are coming from other fractions, as well. Independent market analyst Jonny Moe in his early Thursday tweet, alerted about a potential bearish reversal pattern forming on Bitcoin’s short-term charts. Titled “Rising Wedge,” the rising channel typically prompts an asset to break bearish after a prolonged surge.
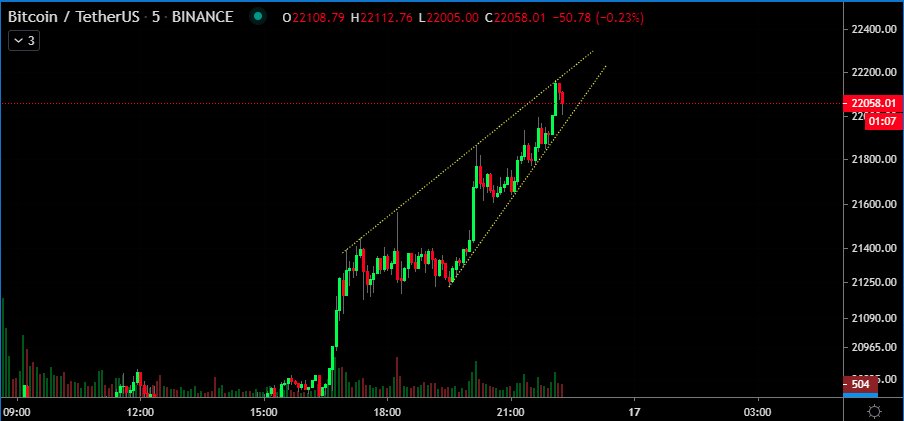
Bitcoin forms the Rising Wedge pattern on a 5-minute chart. Source: BTCUSDT on TradingView.com
“The bears’ last stand,” commented Mr. Moe as he tweeted the bearish chart.
Bitcoin Growth Potential
On long-term charts as well—as the daily one listed above—Bitcoin is showing signs of reversal after testing the Ascending Channel range’s upper trendline. Traders may attempt to short the top with a short-term target towards the previous support near $19,000, followed by an extended sentiment towards the lower trendline, which sits around the $18,700-18,800 area.
But given the macroeconomic setup led by the Federal Reserve’s recent commitment to purchase Treasuries at the same pace and keeping interest rates near zero, it could mean that traders buy the next Bitcoin dip for their long-term bullish outlook. That would translate into the cryptocurrency rebounding towards the Channel’s upper trendline.
The resistance line would then be sitting somewhere near the $24,500-25,000 area.