
Bitcoin is showing signs of replicating its trend from 2019 that crashed its prices by more than 50 percent.
According to a fractal first spotted by TradingShot, an independent trade analytics firm, the flagship cryptocurrency’s downside correction move from its recently-established record high near $42,000 is very similar to its plunge in June 2019. That risks putting BTC/USD en route to deeper price levels in the monthly sessions ahead.
“Notice that both 2019 and today’s Parabolic Rises share a few common characteristics,” said TradingShot analysts in a note published Wednesday.
“Both rose by approximately +385% from the time they last made contact with their 1D MA50 until their respective peaks,” they added. “Both pulled-back from their peaks by approximately -30% on the low before contact was again made with the 1D MA50. At the time of the 1D MA50 test, the RSI was on the Support Zone.”

Bitcoin 2019 and 2021 price moves comparison. Source: BTCUSD on TradingView.com
Bitcoin tested the 50-day moving average as support on Wednesday as its price slipped below $30,000. The cryptocurrency retraced its way to the upside upon facing a comparatively higher buying pressure. Nevertheless, its bullish bias appeared limited owing to a stronger US dollar, reiterating TradingShot’s fears of a 2019 fractal-repeat.
The firm said BTC/USD would need to hold above 50-DMA if it wants to keep its bullish outlook steady. But if the pair breaks bearish on the support, then it risks falling to the next moving average in the queue—the 100-DMA. As of now, it is sitting near $23,000, down 45 percent from Bitcoin’s record high near $42,000.
Meanwhile, if BTC/USD stays above the 50-DMA, its likelihood of continuing its rally back towards $40,000 and beyond would increase.
Converging Bitcoin Indicators
The TradingShot’s 2019 fractal theory matches bias with other technical indicators that, too, point at a further bearish breakdown in the Bitcoin market.
For instance, BTC/USD is fluctuating inside what appears to be a Descending Triangle. Chartists perceive the pattern as a bearish reversal indicator at the end of an uptrend. Typically, the Descending Triangle’s downside target is as much as the maximum distance between its upper and lower trendlines.
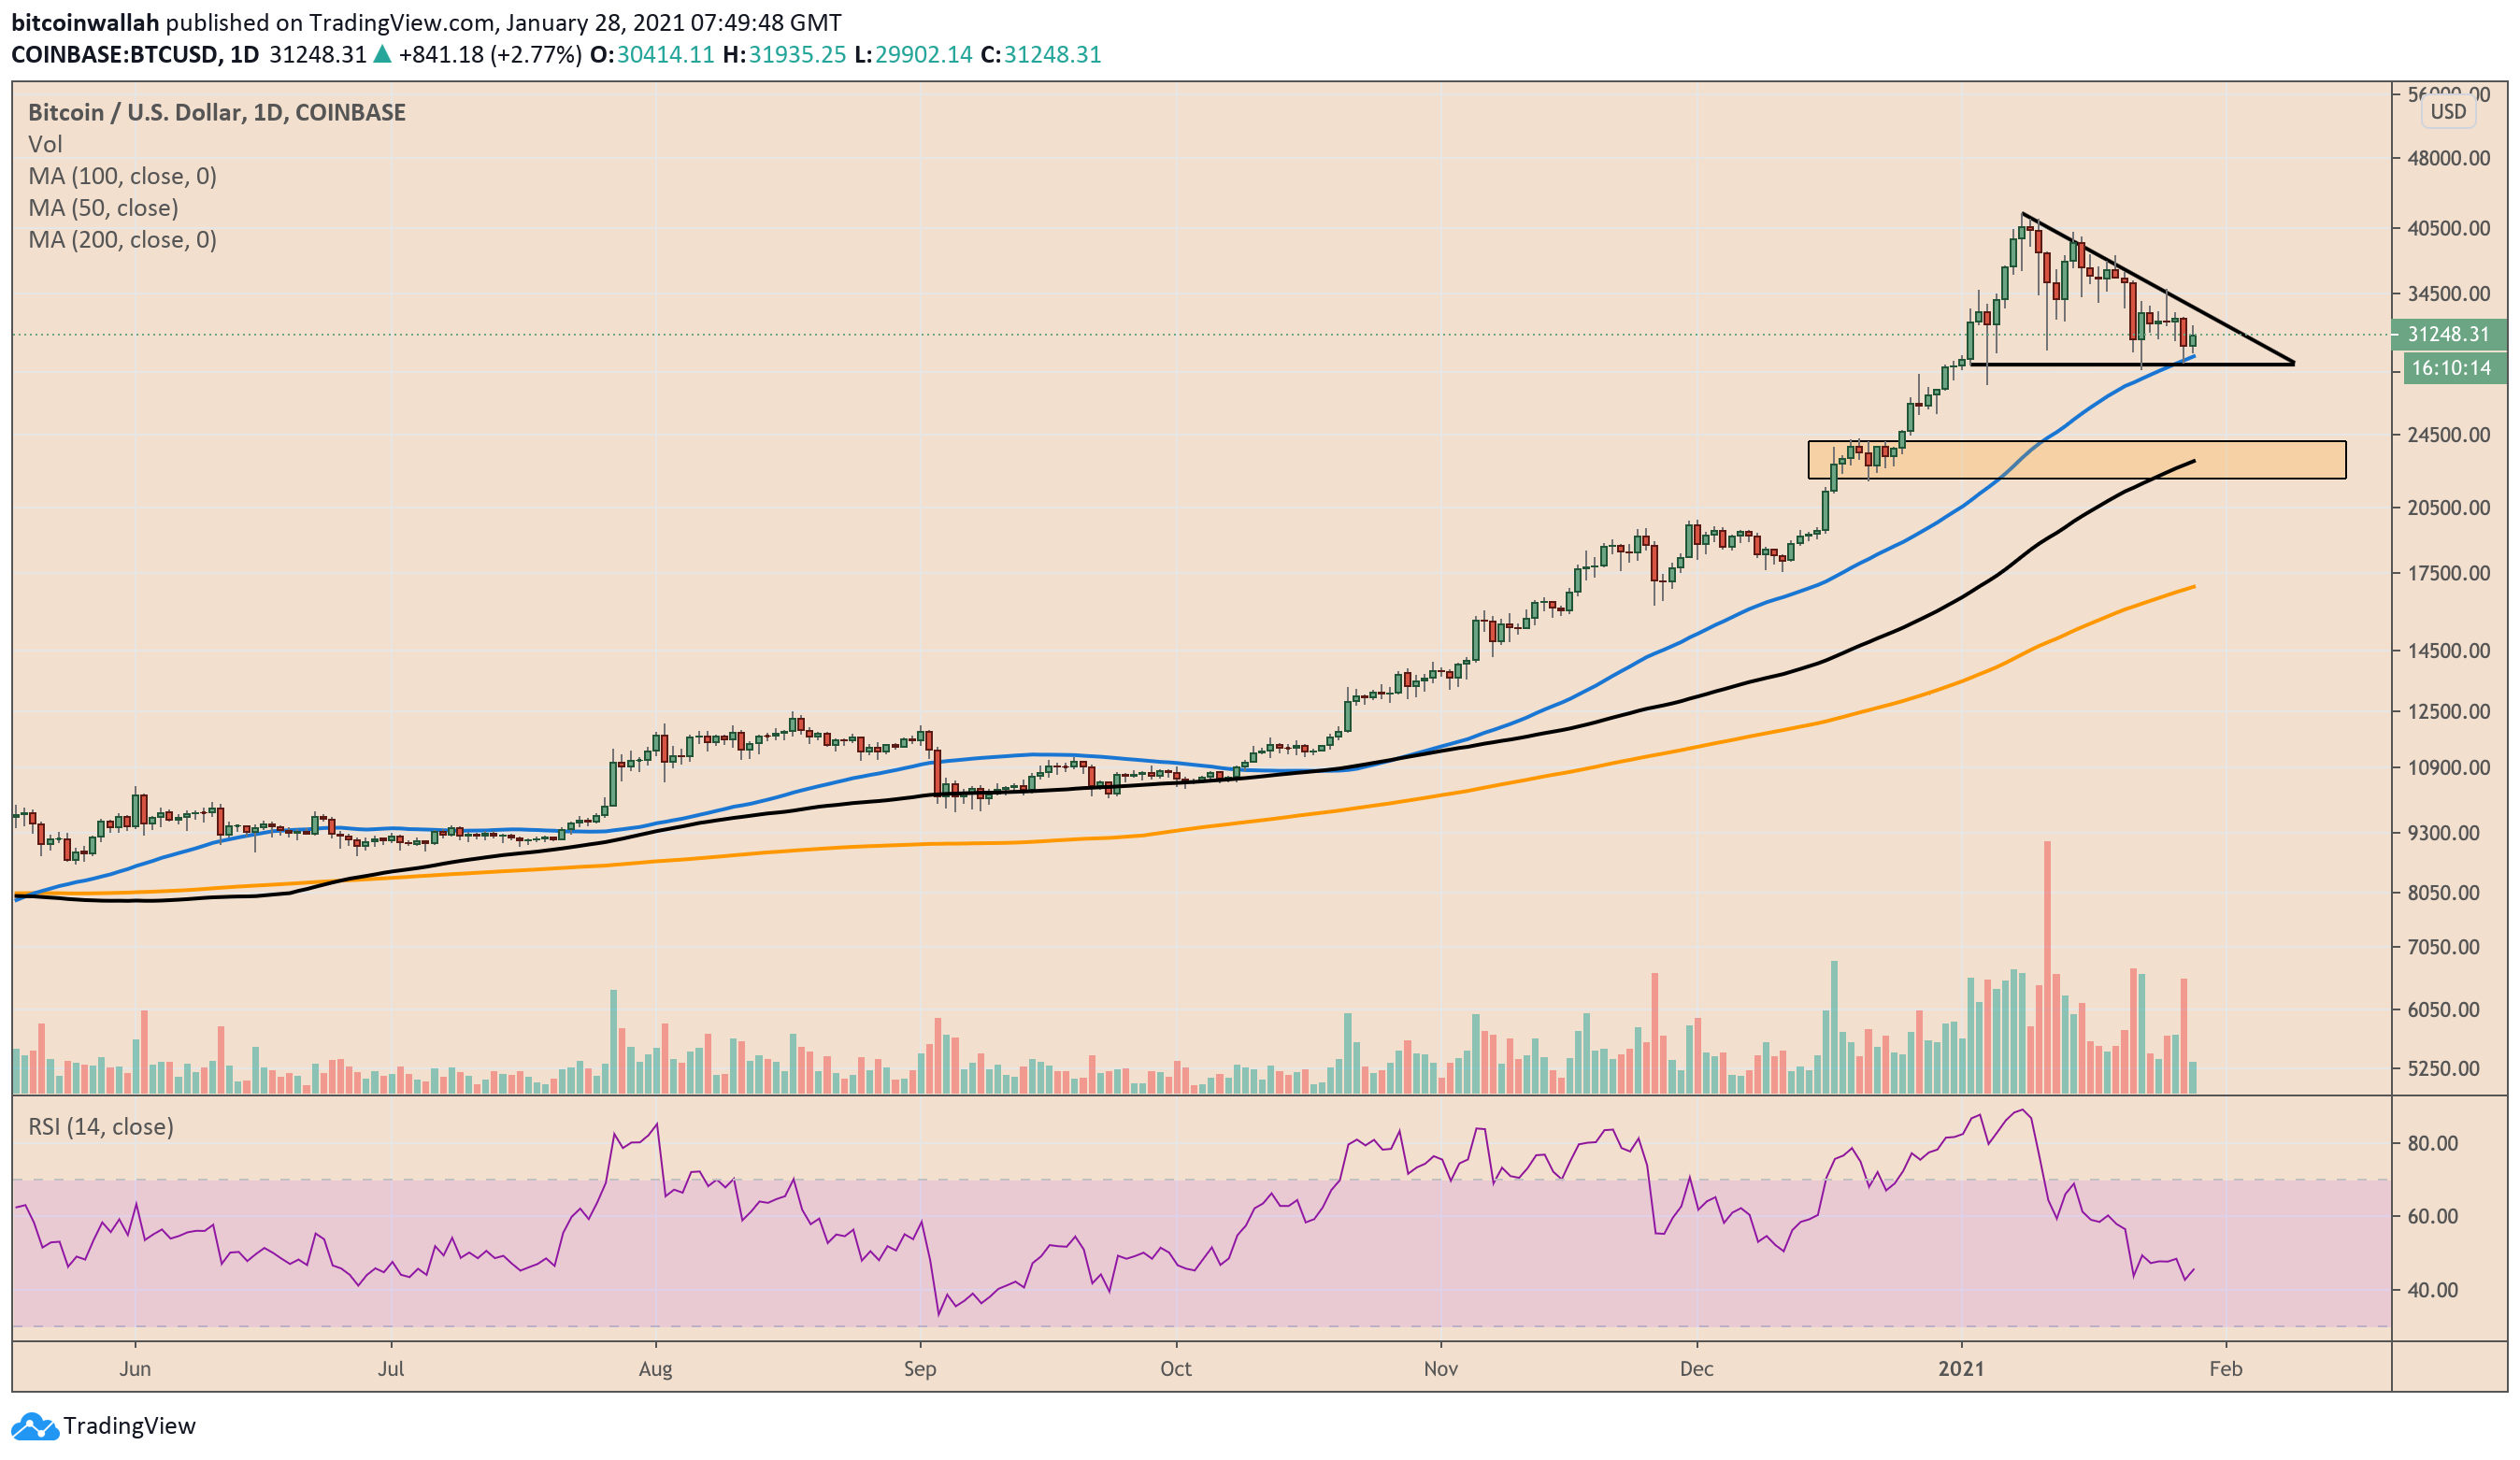
Bitcoin Descending Triangle breakdown warns about a correction to levels below $20,000. Source: BTCUSD on TradingView.com
In Bitcoin’s case, that distance is nearly $13,000. That puts the cryptocurrency en route to its 200-day moving average that sits near $17,000.
The Bullish ‘What If’
Meanwhile, Jonny Moe, an independent market analyst, notes that the Descending Triangle could also shapeshift into a Falling Wedge pattern, which is bullish.
“I don’t think this is what we’re in for, but it’s at least worth acknowledging, the bull case here is that this isn’t a giant descending triangle, it’s some sort of falling wedge type pattern that would form a bottom basically right about where we are now,” he said.
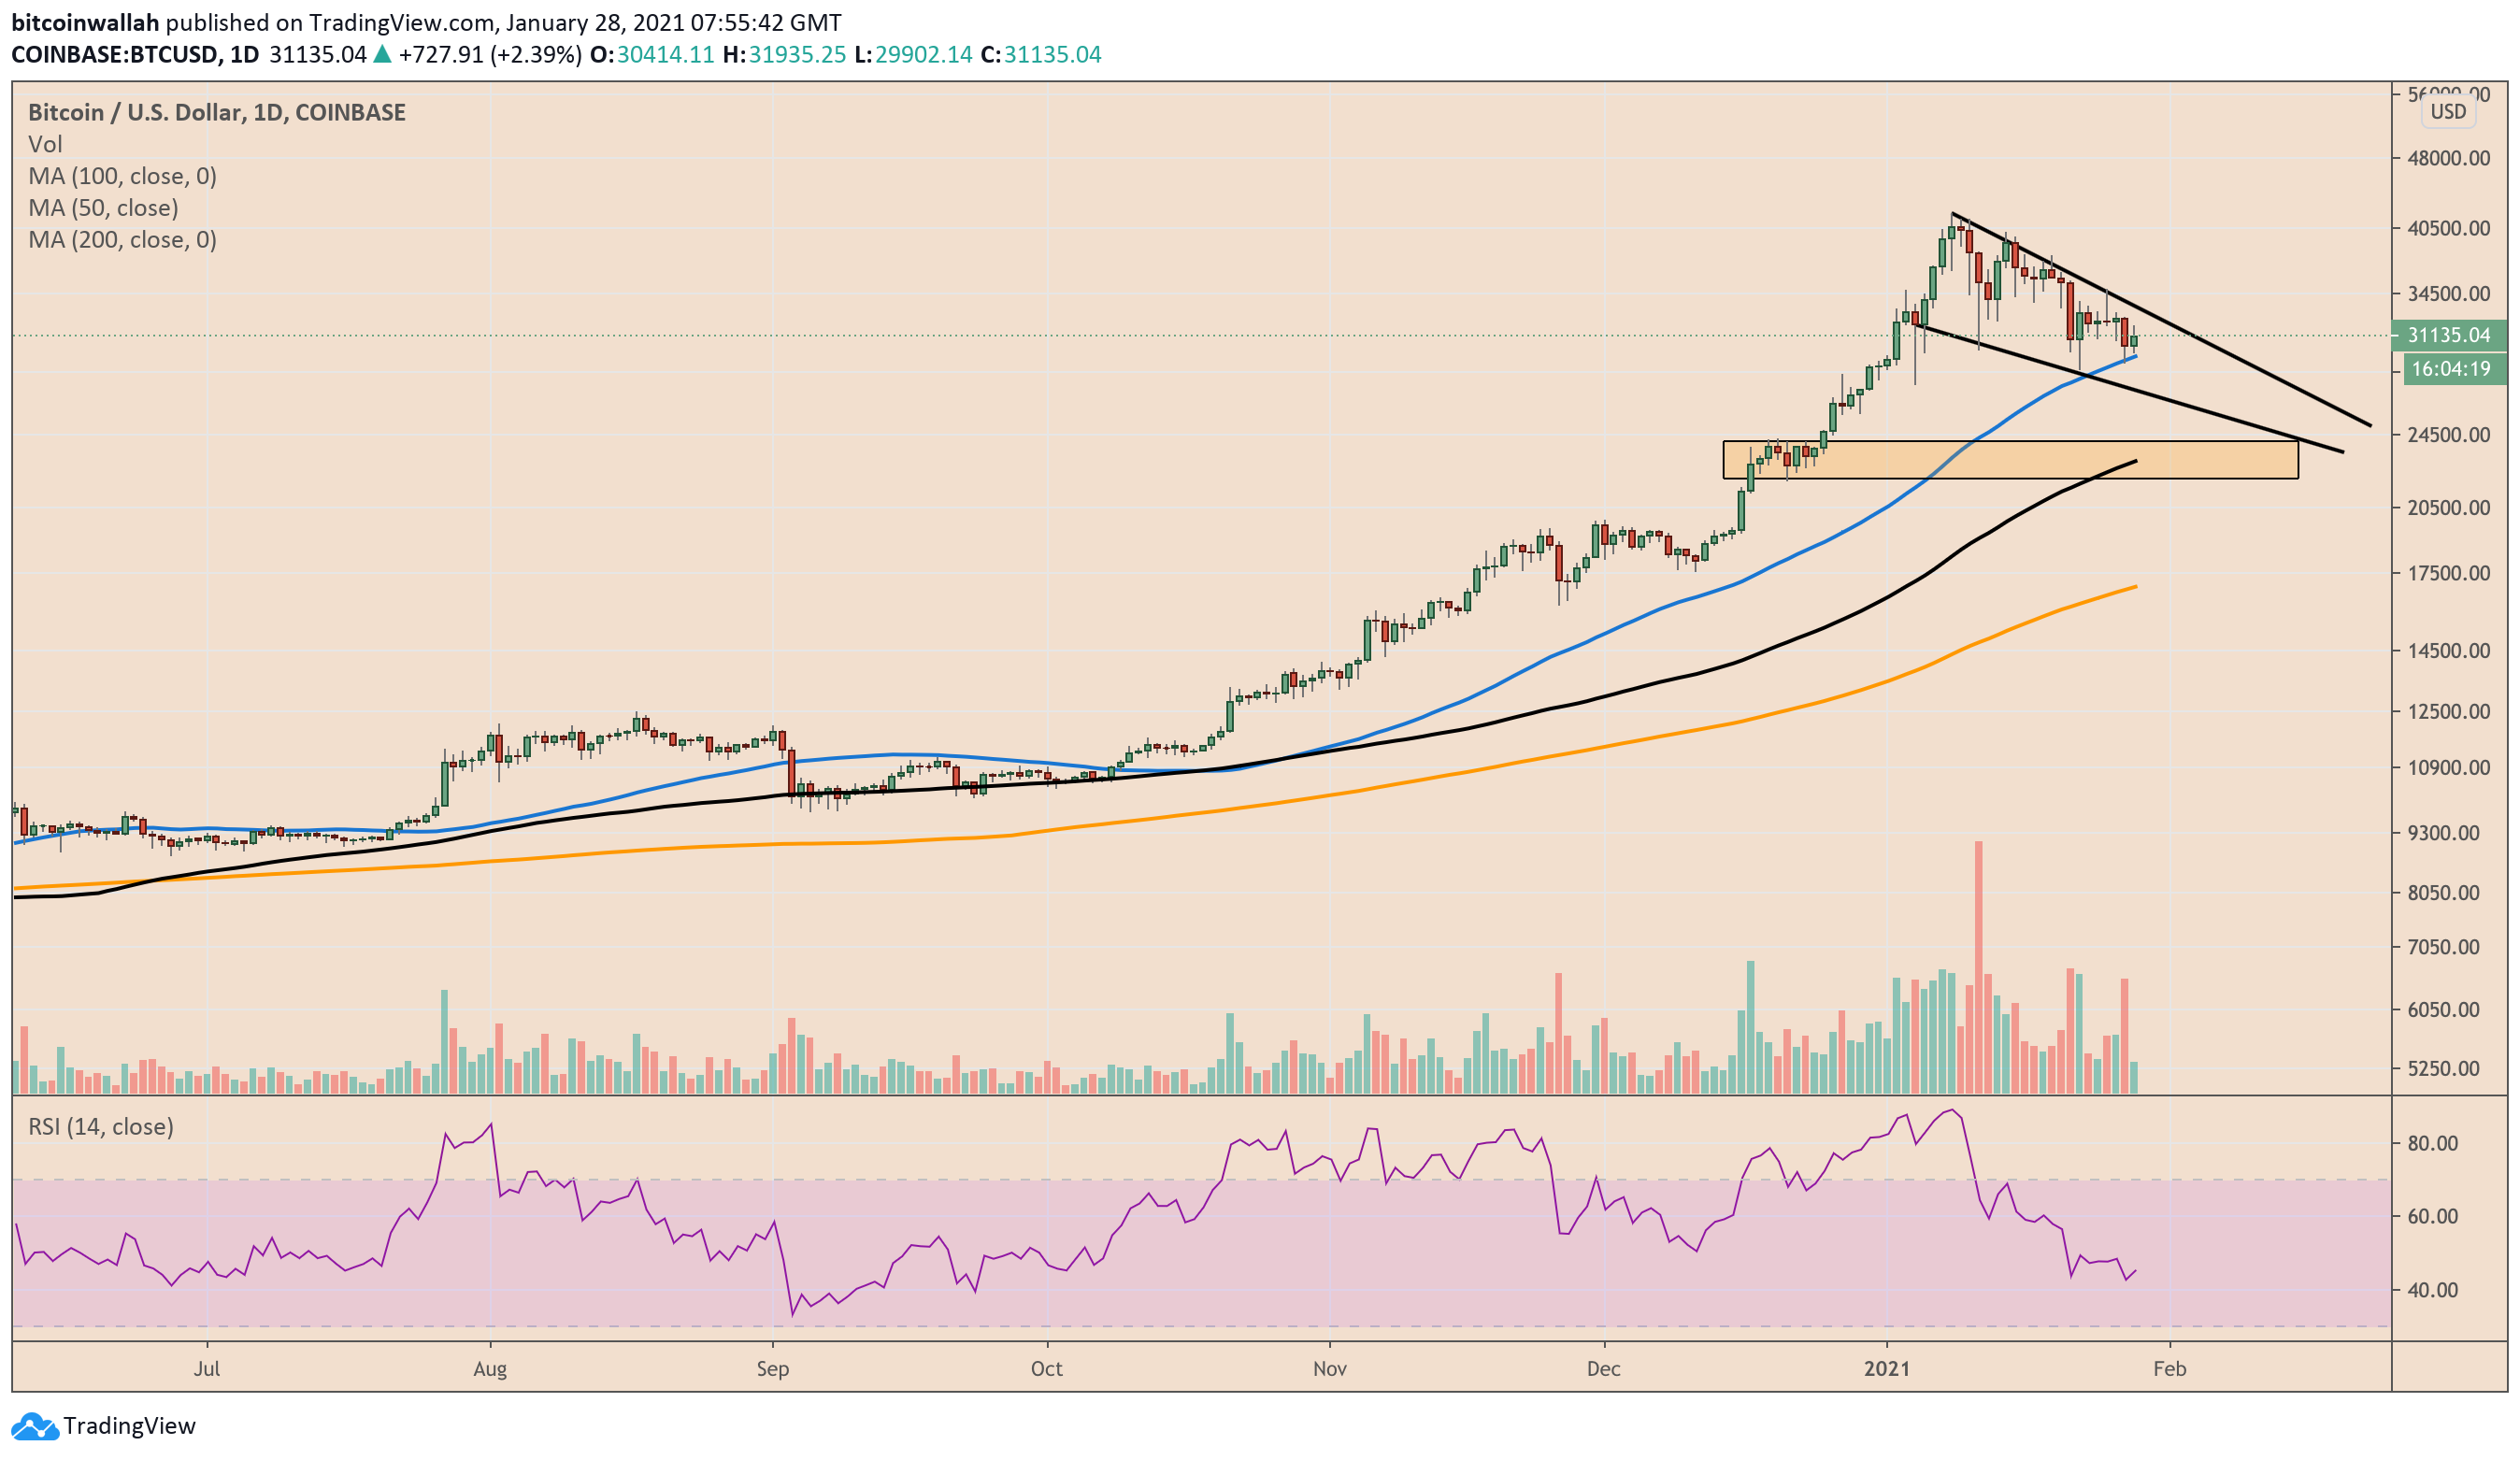
Bitcoin Falling Wedge patterns points at a bullish breakout. Source: BTCUSD on TradingView.com
In either case, it appears Bitcoin would retest the 100-DMA as suggested by TradingShot.