
Data shows the Bitcoin average transaction count has risen to the highest level since April 2021, indicating that the asset’s price could be bullish.
Bitcoin Transactions Are Happening At An Average Rate Of 309,500 Per Day
As per the latest weekly report from Glassnode, the transaction count is currently significantly above the average for the year. The relevant indicator here is the “transaction count,” which, as its name already suggests, measures daily transfers on the Bitcoin blockchain.
When the value of this metric is high, it means many transactions are taking place on the BTC network right now. Such a trend suggests traders are active in the market currently.
On the other hand, low values suggest the network isn’t seeing much activity at the moment. This trend can indicate that the general interest in the cryptocurrency is low among investors currently.
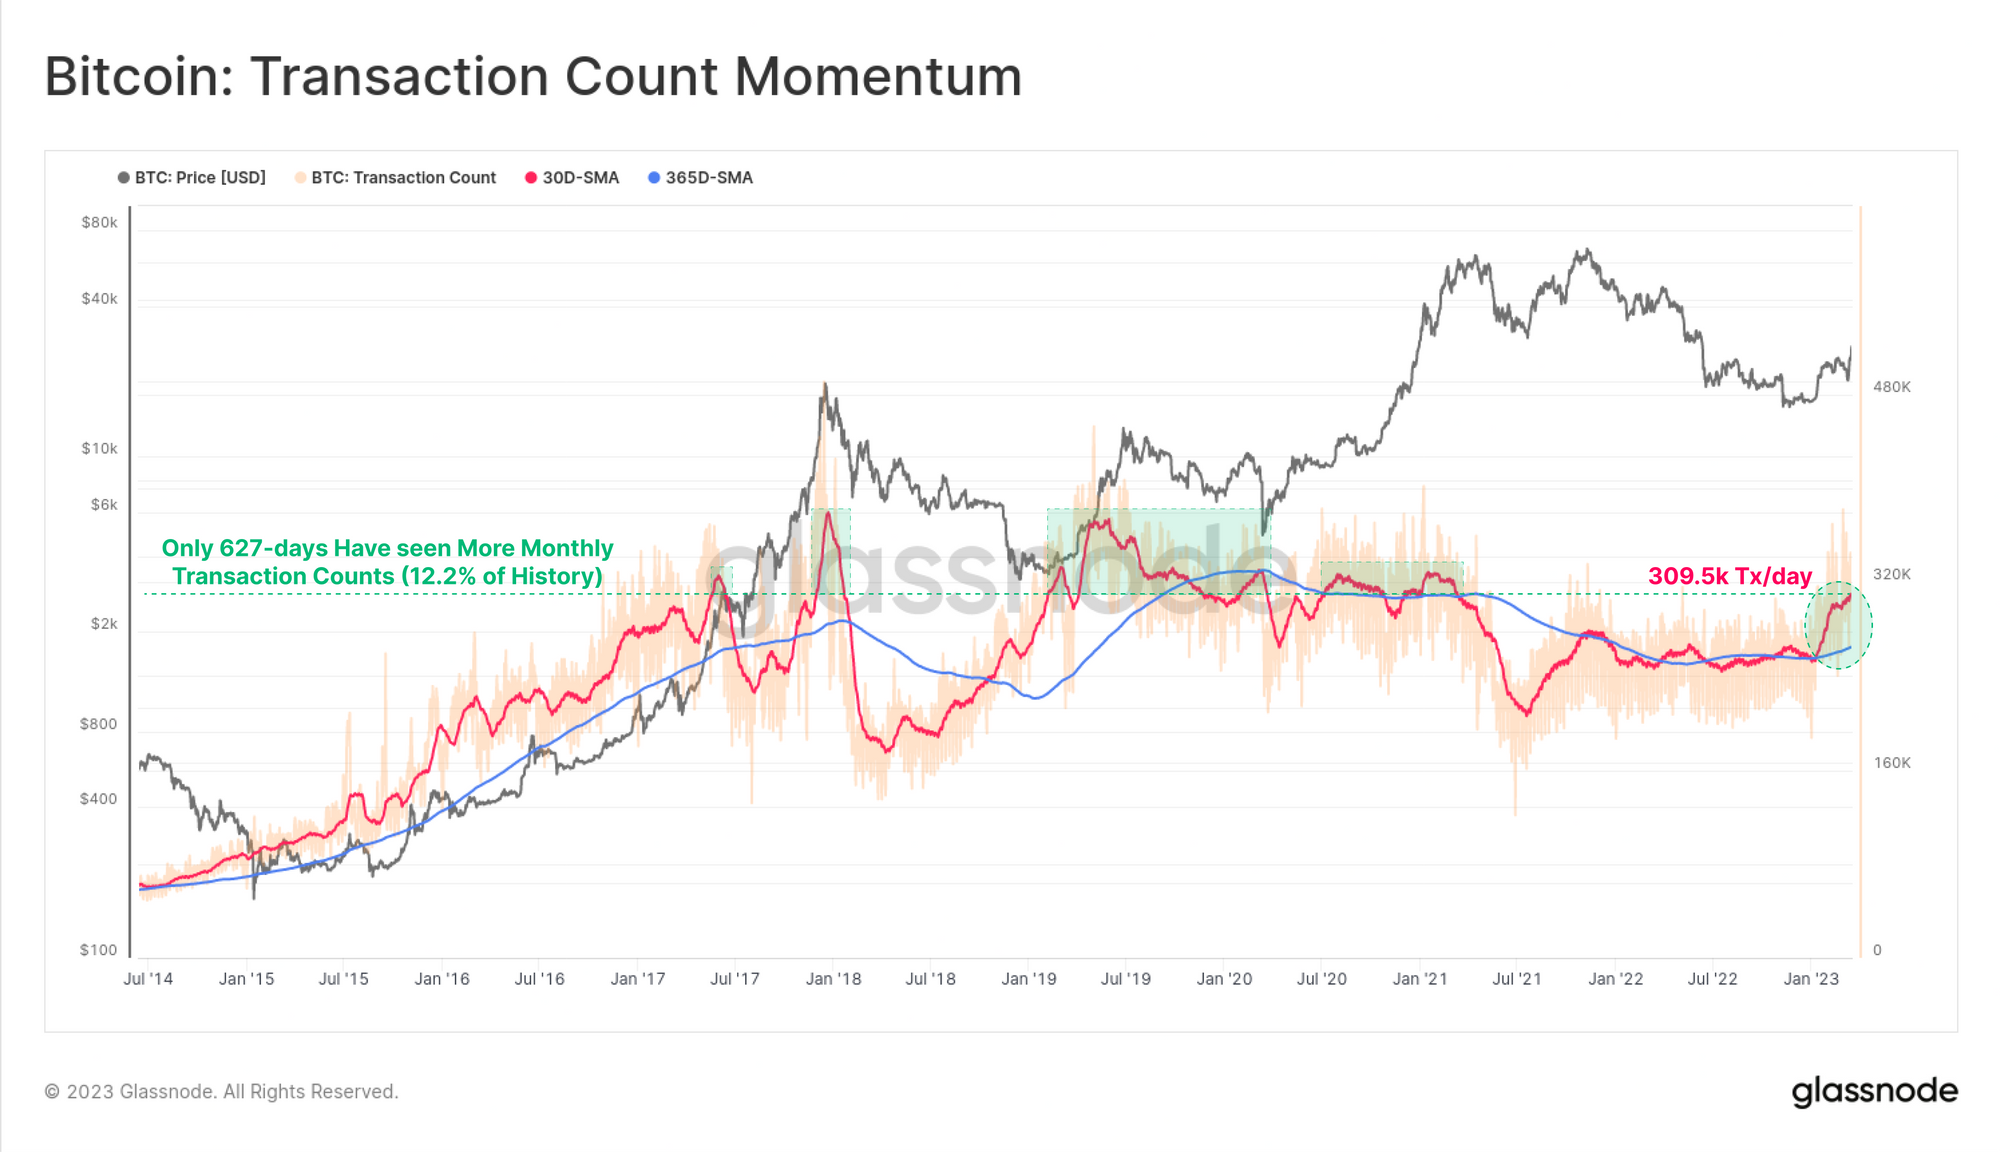
Now, here is a chart that shows the trend in the Bitcoin transaction count, as well as its 30-day and 365-day simple moving averages (SMAs), over the last several years:
The above graph shows that the Bitcoin transaction count has seen some high values during the last few months. This trend isn’t surprising, as rallies like the one the asset is observing now tend to be exciting for investors. Hence they get attracted to the blockchain during such times.
Interestingly, the recent levels of the indicator are higher than what was observed during the bull run in the second half of 2021. The 30-day SMA value of the metric had now surged to 309,500 transactions per day, the highest the metric has been since April 2021, when the bull rally of the first half of 2021 was at its height.
There have only been 627 days in the entire asset lifetime (equal to 12.2% of BTC’s history) with a higher 30-day average daily transaction count.
Generally, high transaction count values can imply are not only old users showing high activity but also that new users are joining the network. As the indicator’s value has been quite significant recently, it’s a likely sign that cryptocurrency adoption has surged.
Prolonged high transaction counts can provide a sustainable base for bullish momentum in the long term as new users coming in and transacting on the chain is what keeps the Bitcoin economy churning.
From the chart, it’s apparent that the 2017 bull run, the April 2019 rally, and the 2021 bull run all saw pretty high monthly average values of the indicator in their leadups, showing this theory working in practice.
BTC Price
At the time of writing, Bitcoin is trading around $27,800, up 14% in the last week.