Much has been said about Ethereum flipping Bitcoin in the past, particularly during the 2017 bull cycle when the ETH/BTC ratio peaked at 0.157.
However, fast forward to now, spurred by the ongoing banking crisis narrative, Glassnode data analyzed by CryptoSlate suggests a period of Ethereum underperformance ahead – putting paid to the idea of a “flippening.”
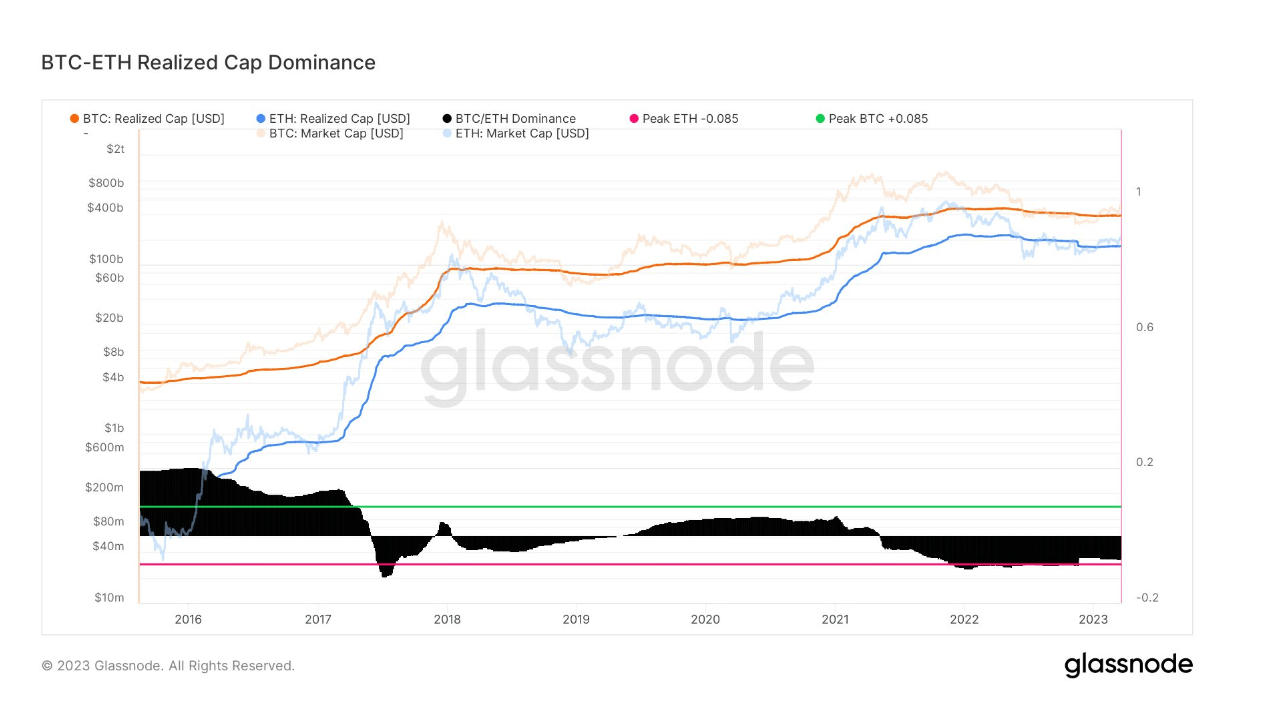
Bitcoin – Ethereum realized cap dominance
Market cap is the most popular way to value and compare cryptocurrencies. It is calculated by multiplying the current price by the circulating supply.
A variation on the market cap method is realized cap, which substitutes the current price in the above calculation with the price when the coins last moved. Proponents argue that this gives a more accurate valuation due to minimizing the effects of lost and irretrievable coins.
The chart below documents the Bitcoin and Ethereum market and realized caps since 2016. It shows a tightening between BTC and ETH in June 2017, especially when viewing the realized cap lines.
Around April 2019, the two began to diverge. But by May 2021, a further narrowing of the two bands occurred. However, Ethereum’s realized cap has started to dip in recent weeks, with Bitcoin’s holding relatively steady.
The chart also plots BTC/ETH dominance, calculated by taking the BTC market cap and dividing by [(BTC market cap + ETH market cap) – 0.765]. The 0.765 figure visualizes the oscillator around a long-term mean value. It shows the market is beginning to leave a two-year-long period of ETH dominance.
 Source: Glassnode.com
Based on the current situation, markets are bracing for higher rates and banks continuing to tighten credit availability – a scenario generally favorable to risk-off assets.
Ethereum is considered a more risk-on, higher beta than Bitcoin, suggesting it will underperform versus the leading cryptocurrency going into a risk-off environment.
Ethereum fundamentals
Analysis of Ethereum fundamentals also suggests under-performance going forward.
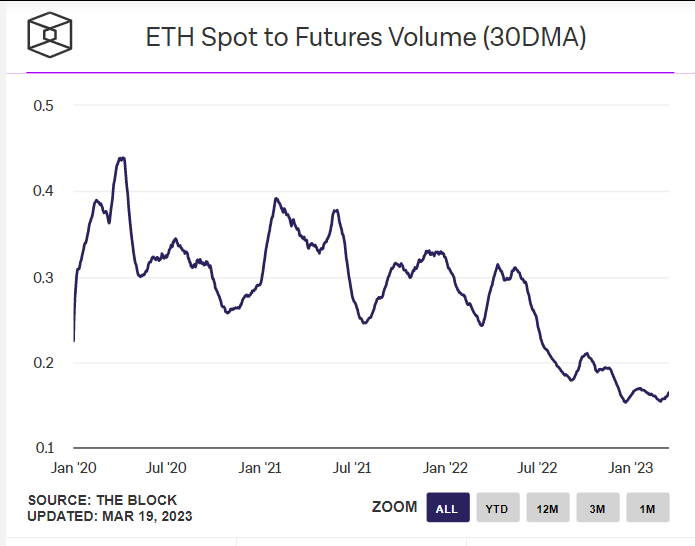
A general indicator of ecosystem health is a high/rising Spot to Futures ratio – this indicates an ecosystem where holders dominate traders, whose intention is profit rather than belief in the ecosystem.
Data from the Block on ETH Spot to Futures volume shows a macro downtrend since April 2020. The downtrend accelerated around May 2022 (Terra-LUNA implosion) and has since fallen to an all-time low.
 Source: theblock.com
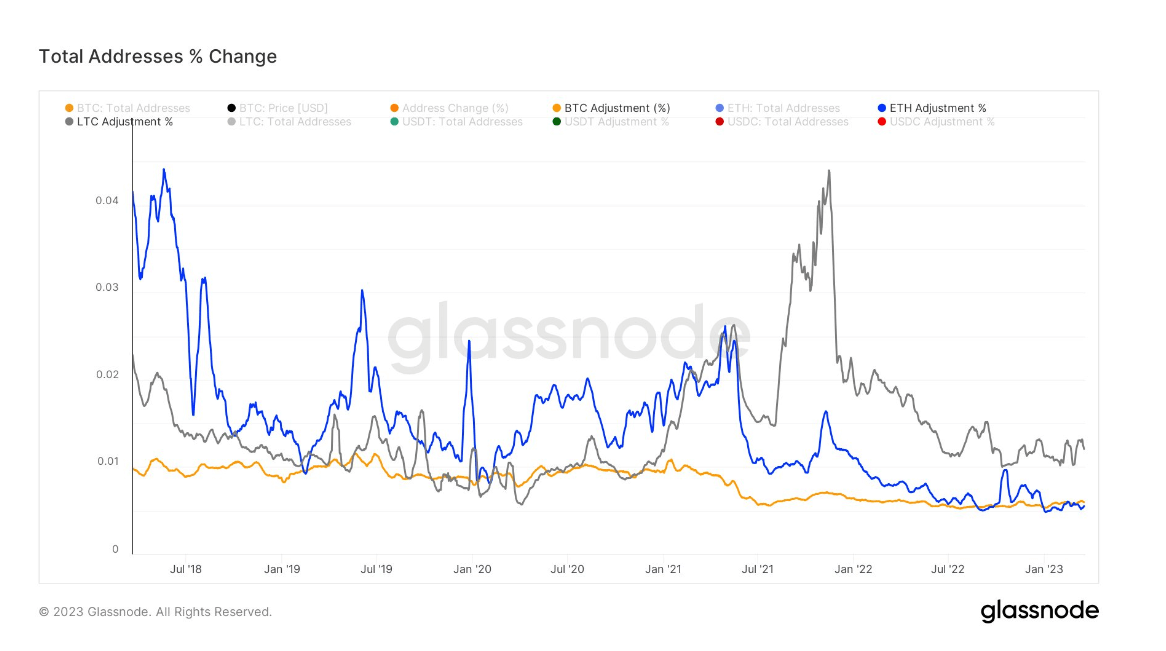
The percentage change in total ETH addresses has decreased over the past five years, dipping below BTC last month.
Likewise, the percentage change in total LTC addresses began pulling away from ETH (and BTC) around June 2021, remaining consistently higher ever since, particularly moving into the market top around November 2021.
 Source: Glassnode.com
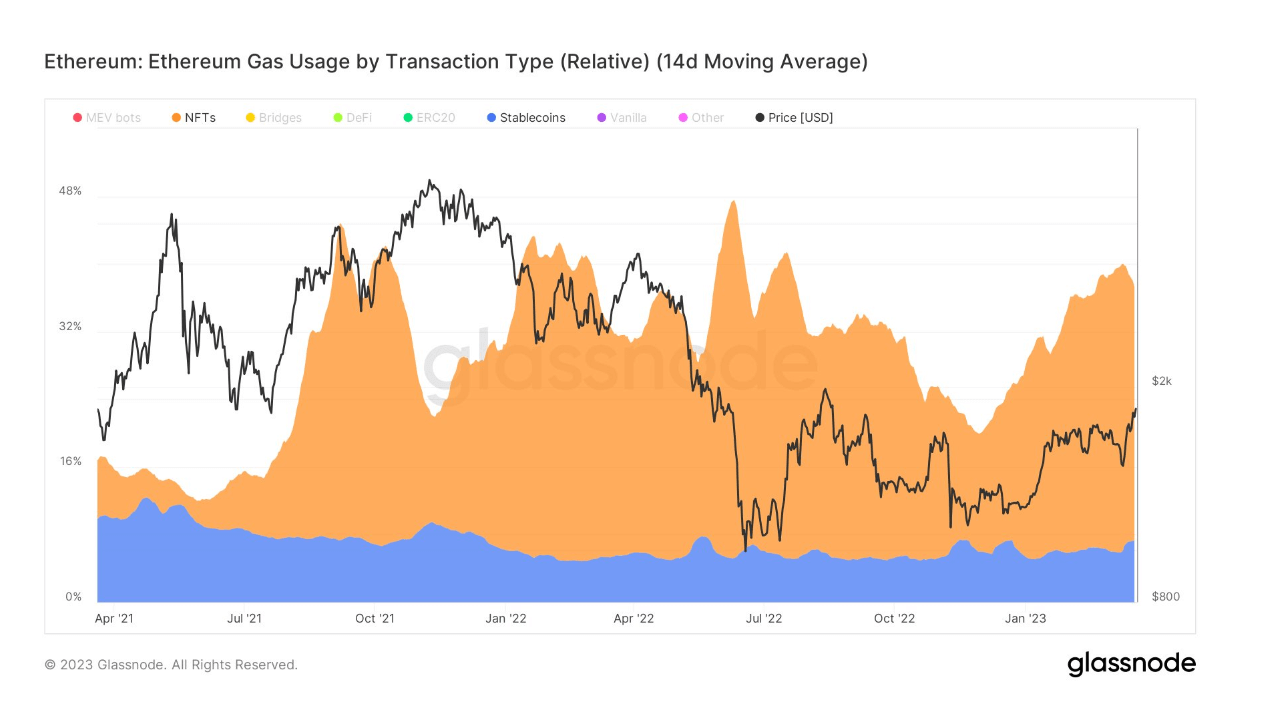
On-chain data shows that stablecoin and NFT transactions make up the most significant gas usage on ETH, with the former spiking higher around December 2022. The latter has remained consistently, relatively flat since April 2021.
In June 2022, stablecoin and NFT transactions comprised nearly half of ETH’s gas usage. Now, the percentage is about 35%, indicating a general downturn in these applications on the ETH chain.
 Glassnode.com
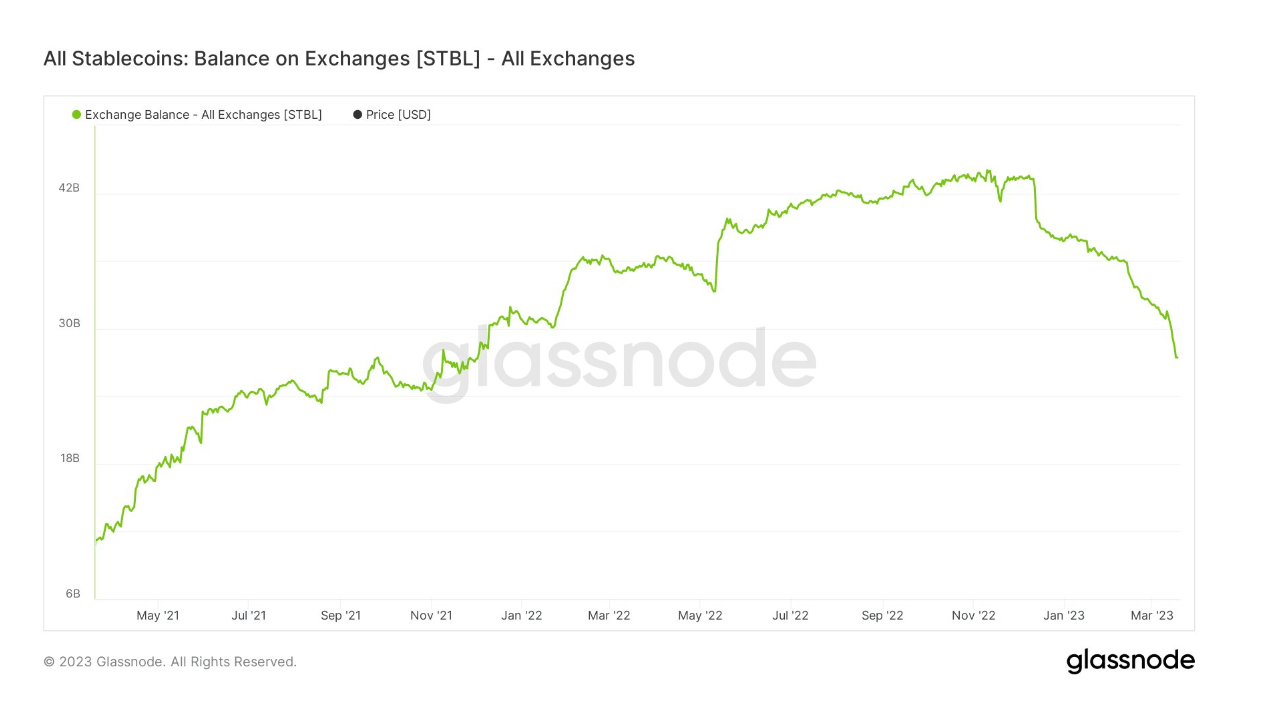
This can be explained by the rising popularity of Ordinals on BTC, which has somewhat lessened ETH NFT demand. Similarly, stablecoins on exchanges have sunk to a 17-month low – suggesting a general decrease in their importance to crypto, likely due to ongoing narratives around their safety/redeemability.
 Source: Glassnode.com
The Merge narrative led to bullish price drivers in the switch to Proof-of-Stake and deflationary tokenomics. However, more than six months on, ETH continues to lose against Bitcoin. Several reasons could be behind this.
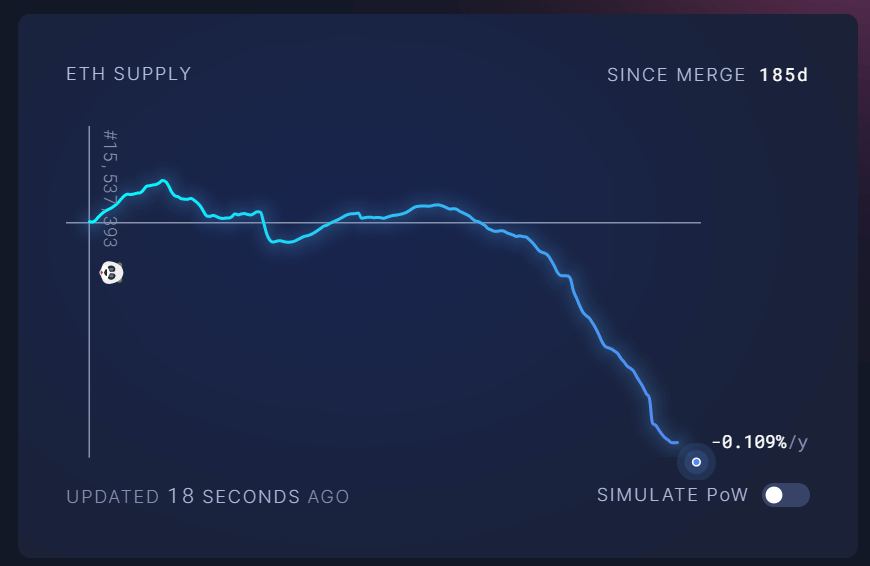 Ethereum supply: (Source: ultrasound.money)
Since the Tornado Cash sanctions, Ethereum’s reputation as an uncensorable, decentralized chain has taken a significant hit. More than half of the blocks are still Office of Foreign Asset Control (OFAC) compliant, meaning more than half of the network will exclude transactions at the behest of U.S. authorities.
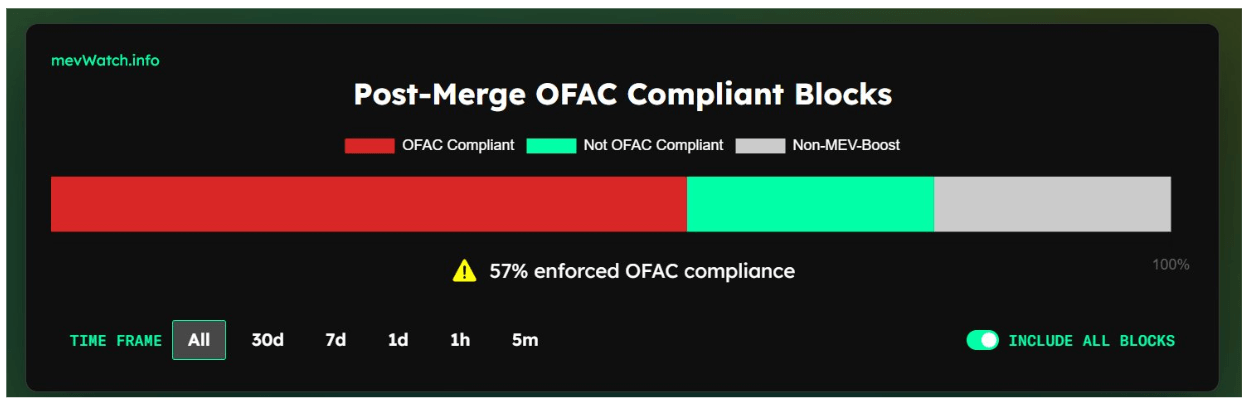 OFAC Compliant Blocks: (Source: mevwatch.info)
Also, while devs were transparent in stating the Merge would not lower fees directly, there remains an ongoing, unresolved issue with costly transactions. The chart below shows transaction fees recently shot up to approximately 5k ETH.
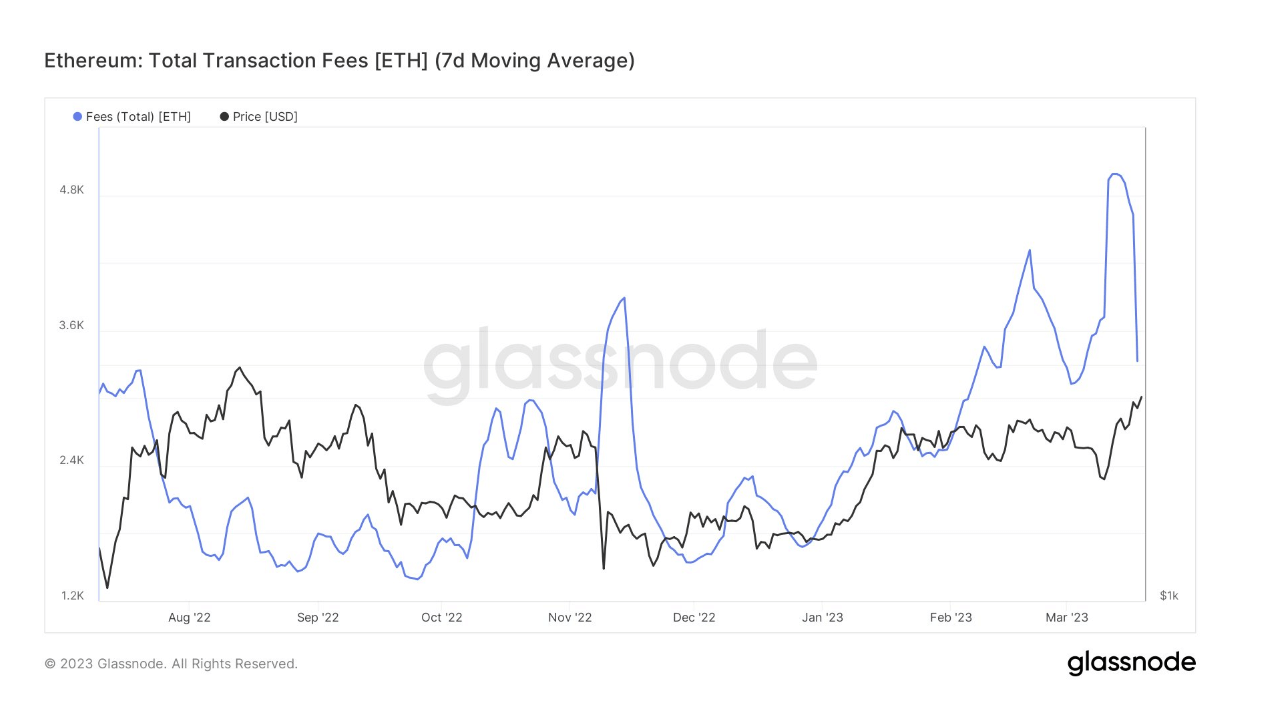 Source: Glassnode.com
The ETH/BTC ratio is currently at 0.0635, less than half that during the 2017 peak. Since the banking crisis, a notable drop off in the ratio occurred, suggesting the market overwhelmingly favors Bitcoin in these uncertain times.
The post Research: Why the Ethereum/Bitcoin ratio will continue to fall appeared first on CryptoSlate.